Ski history and the introduction of flex curves
Although the concept of skiing dates long back, commercial production of skis became huge first in the 20th century. From the 1950s and onward, the introduction of material structures with metal, fiberglass or carbon fiber, resulted in more complex products. Today, the construction methods enable fine-tuning of ski characteristics when it comes to quality, user preferences and durability.
As mentioned by the Norwegian ski producer Endre Hals, the last 10 years have seen a dramatic change in public awareness of ski shapes. This has forced ski companies to modify their construction facilities. Moreover, with the increased demand for personally adapted products comes the need for a measure of the various qualities.
Important in this discussion is the notion of ski stiffness, or perhaps its more common version known as the ski flexibility, or flex for short. The geometry and choice of materials impact the physical properties of alpine skis, and the complexity of today's models may just increase the stiffness variability. Endre Hals notes that there have been much debate about ski stiffness, but the arguments lack an objective language.
The ski flex index
Essential in this context is how the flex should be calculated. In an article, longitudinal deflection is measured via placing weights on the binding mounting center of the ski. But, as Hals argues, this simple process does not capture a satisfactory amount of information. As a remedy, he proposed so-called flex curves and a new standard called the ski flex index (SFI) in his diploma thesis.
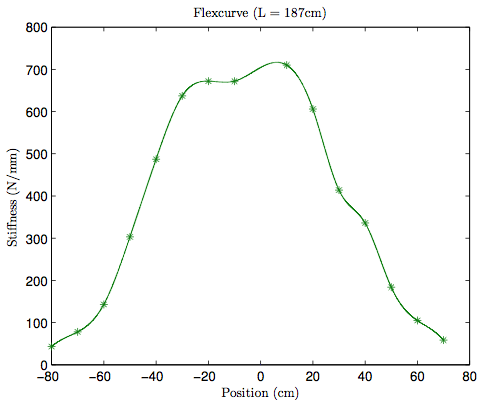
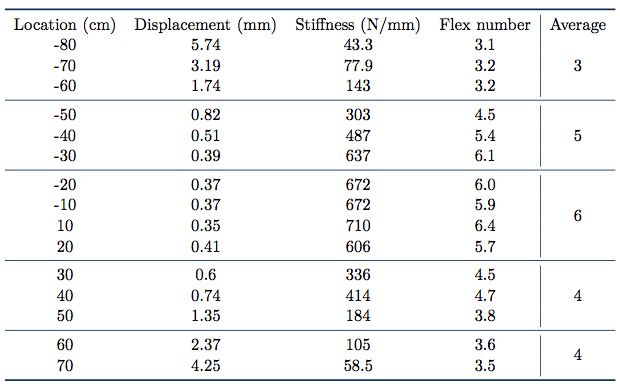
Cooperating with the Norwegian sports magazine Fri Flyt, he measured selected freestyle- and freeride skis for the 2008 season. With the middle of a ski as a reference point and origin, typically 8 deflection tests on both sides of the ski were used for calculating displacement. Moreover, each such measurement was separated by 100 mm. He then combined the results into flex curves, which draw the distribution of ski stiffness. At the same time some recalculations have been done to make skis of different lengths comparable. An example of a flex curve can be seen in Figure 1 with measurements from Table 1.
In order to ease the understanding of the data for the broader public, the ski flex index consists of five numbers corresponding to the back tip, back ski, mid ski, front ski and front tip, respectively. The numbers, ranging from 1 through 9, are based upon a formula via average flex curves. Soft skis get low numbers, while large numbers correspond to stiff models, and a completely average ski gets the SFI 5 5 5 5 5. The ski from Table 1 results in the SFI 3 5 6 4 4, which suggest an overall flex index of 4. As Hals comments, it is still open what values may be considered optimal, but they may anyway serve as a better foundation for further discussions.
The project report
Mathematical modeling of flex curves in customized alpine skis using isogeometric analysis
The project’s problem description
In our report we have tried to set up a complete model of a customized alpine ski in order to estimate its associated flex curve. Our goal has been to computationally replicate the entire measurement procedure done by Hals, and then compare the estimated flex curve with real data.
We do not focus on the SFI, which we believe to be an unstable standard. Since it is based on average flex curves, the ski flex index will actually float during the coming years. The flex curves are, however, not affected by this.
The analyzed ski is designed by Endre Hals, and in close cooperation with him, we have tried to create a 3D CAD model which captures the essential features of the ski. Several extensive laboratory tests have been carried out for the estimation of key material properties.
As a mathematical framework, the so-called isogeometric analysis (IGA) approach has been used. Building on the finite element method (FEM), IGA establishes a direct link between CAD design tools and FEM software which enables exact transfer of the geometry. Our reason for choosing IGA was twofold. First, it is a very fresh and promising technology, being introduced in 2005 by Hughes et al. Second, having acquired some experience with FEM, extending to IGA seemed like an interesting challenge. In addition our working team consisted of members capable of designing CAD models.
The governing physical equations throughout the project are based on linear elasticity, and the underlying assumptions from linear elasticity fit well in this context since the measured displacements are small. Also, the resulting partial differential equations give numerical procedures adequate for the level of the working team.